|
Poincare Surface of Section dialog box |


|
Use this dialog box to compute the Poincare surface of section for selected series.
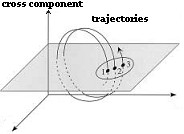
Poincare section of a 3-D trajectory into a 2-D plane. Points are recorded as they cross through the surface.
Input
Specifies the worksheet location of the input data for this operation.
Provides a reference to the extent of the data available in the currently active worksheet. Use this range as a guide for typing valid extents in the Input Range box.
Type in this box the range of cells containing the data you want to use as input for this command.
Check this box to indicate that the data specified by the Input Range box is organized in rows as opposed to columns (the default).
Refer to Specifying Input Arguments for additional information on this subject.
Output
Specifies the worksheet location for placing the results of this operation.
Select this option to place the results of this operation in a new document workbook.
Select this option to place the results of this operation in a new worksheet.
Select this option to place the results of this operation starting at the worksheet location specified in the box to the right of this option.
Refer to Specifying Output Locations for additional information on this subject.
Options
Single Series
Select this option to indicate that the data specified by the Input Range box represent individual series.
Multivariate
Select this option to indicate that the data specified by the Input Range box represent one multidimensional series.
Refer to Specifying Input Arguments for additional information on this subject.
Specifies the number of dimensions that will be used for embedding the selected series. Type in this box an integer number greater than 1.
| It is not possible to plot the result of a Poincare surface of section if the number of specified dimensions exceeds 5. |
Specifies the time delay that will be used for embedding the selected series. Type in this box an integer number greater than 1.
Specifies the dimensional component that will be used to plot the crossings.
Component Mean
Select this option to create the hyper-plane for crossings at the mean coordinate of the dimensional component selected for the crossings.
Extent Fraction
Select this option to create the hyper-plane for crossings at a coordinate specified by a fraction of the extent of the dimensional component selected for the crossings, then type the extent fraction in the Coordinate/Fraction box.
Coordinate
Select this option to create the hyper-plane for crossings at a coordinate of the dimensional component selected for the crossings, then type the coordinate in the Coordinate/Fraction box.
When you select the Extent Fraction or the Coordinate option, you must type in this box a real number specifying the fraction of the extent or an absolute coordinate, respectively, where you want to create the hyper-plane for crossings.
| For extent fractions, the number typed in this box must be greater or equal to 0 and smaller or equal to 1. |
Pierce Direction
Select this option if you want this algorithm to only consider hyper-plane crossings coming from below.
Select this option if you want this algorithm to only consider hyper-plane crossings coming from above.
Select this option if you want this algorithm to consider hyper-plane crossings from any direction.
Additional Options
Specifies options for reporting the time between crossings.
None
Select this option if you do not want crossing time included in the results of this operation.
Time Lapse
Select this option if you want crossing time reported in terms of lapses from previous crossings.
Actual Time
Select this option if you want crossing time reported in terms of actual time.
| Time is reported in terms of vector order. In this context for example, the lapse between 2 contiguous vectors, vector 43 and vector 44, is 1 time unit and they occur at times 43 and 44, respectively. |
Check this box to plot the results of this operation.
| This option will be ignored if the number of specified dimensions in the Dimensions box exceeds 5. |
Closes the dialog box and carries out this operation.
Closes the dialog box without carrying out this operation.
Sponsored
Try Predictive Systems Lab
Need Help?
Contact support